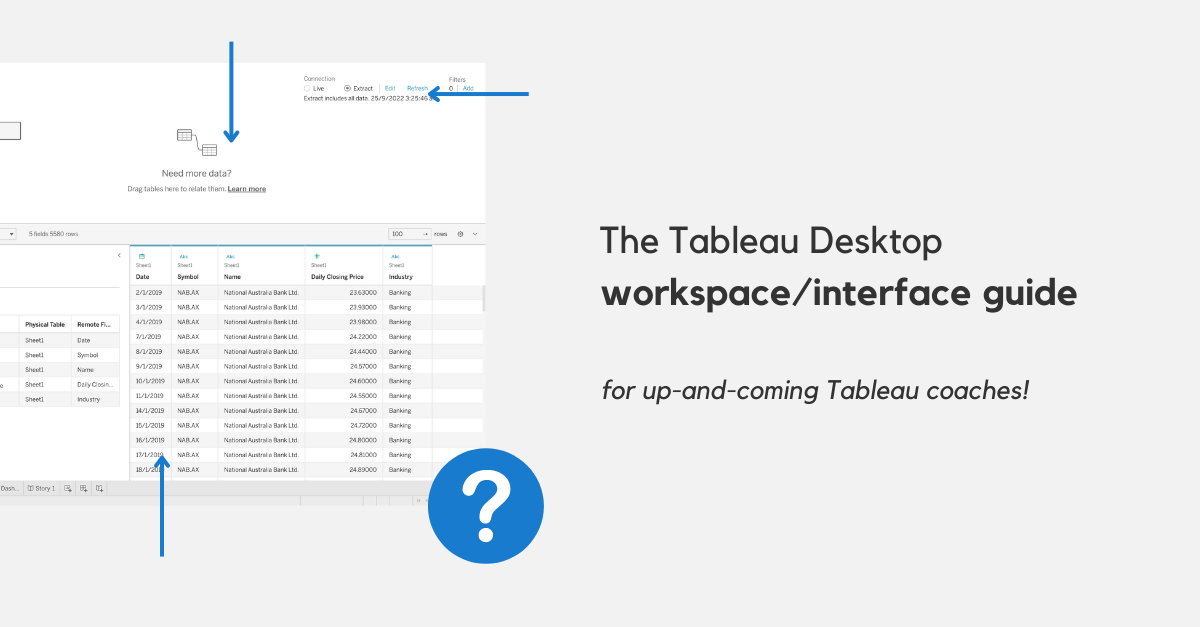
The Tableau Desktop workspace/interface guide
Posted on: October 1, 2022
Post Category: Data
While I was teaching Tableau over the past two years, I’ve always been confused with the terms used to refer to certain workspace/interface components.
The terms I used were sometimes inconsistent.
For instance, I would refer to the Data Source Page as the “Data Source Pane”.
And sometimes I would refer to the Rows shelf as the “Rows area” or “Rows bar”.
Ever since watching some of the video tutorials on Tableau’s e-learning platform, I figured it would be better for my teaching if I consistently used the correct terms for parts of the workspace/interface.
And what better way to improve how you teach Tableau, than by learning how to speak the language used by the company?
This is what this blog post is all about.
I wrote this blog post to break down the language that the people at Tableau (the company) use to refer to different parts of the Tableau Desktop interface, when they do their demonstrations.
You will learn about the different main components/terms, like the canvas, pane, tab, shelf and dialog box, through annotated screenshots of Tableau Desktop AND a short UI crash course.
So here they are…
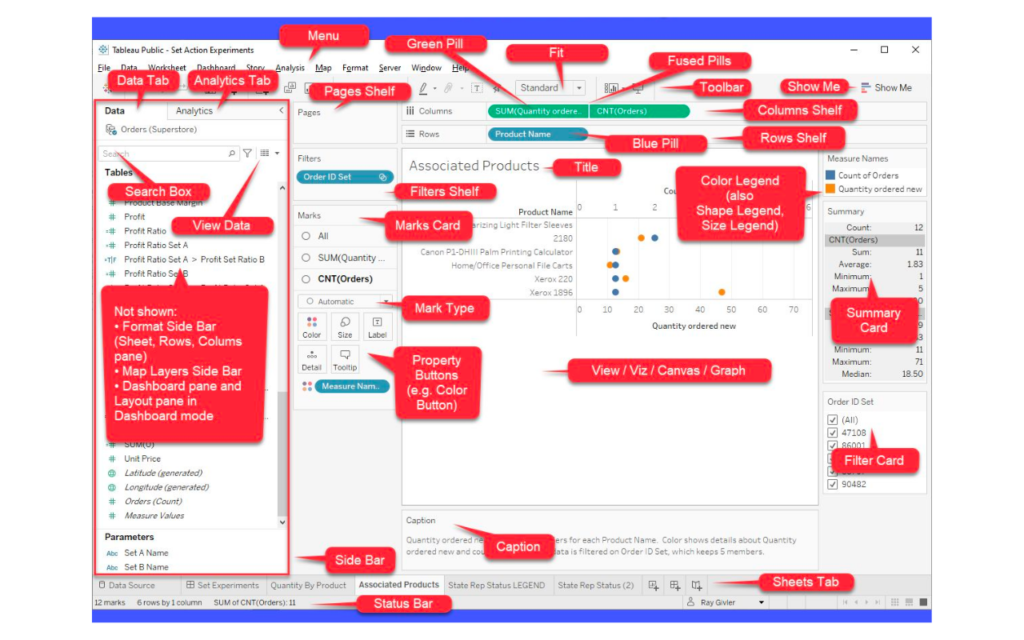
The Tableau Desktop workspace main components – labelled

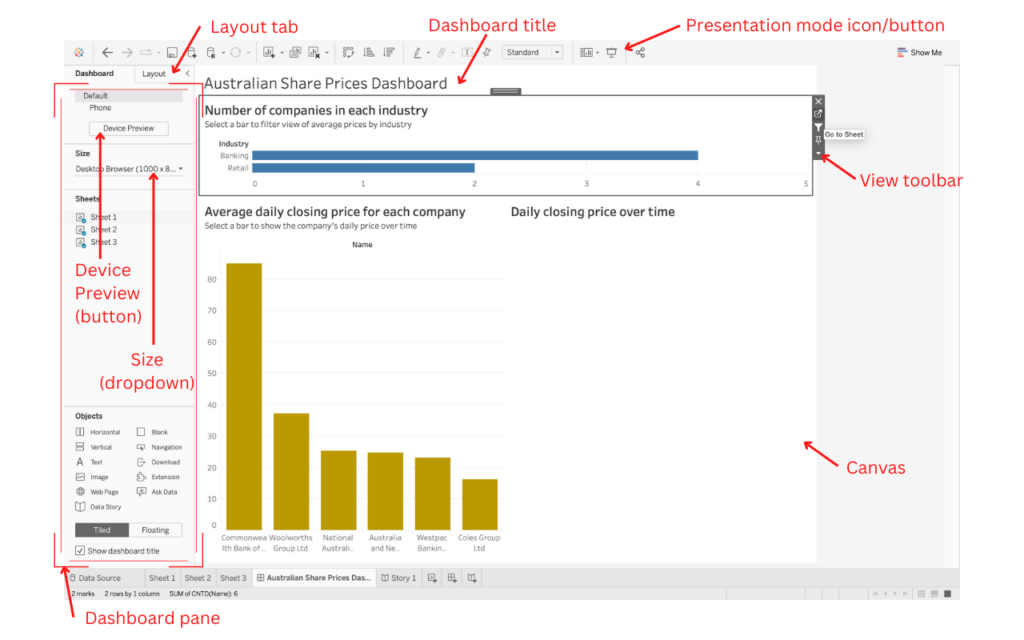
And a short UI crash course
A good way to help remember names of the different workspace components is to understand where they come from.
Knowing simple UI terms helps with this.
Here are some important definitions to help you:
Window: a framed area on a display screen for viewing information e.g., the Desktop window, Tableau Desktop window, Microsoft OneNote window. Generally, windows of running applications will have options at the top – to full-screen, minimise or close.
Tab: a clickable area that shows another page/area of the application e.g., the Data Source tab, the Analytics tab.
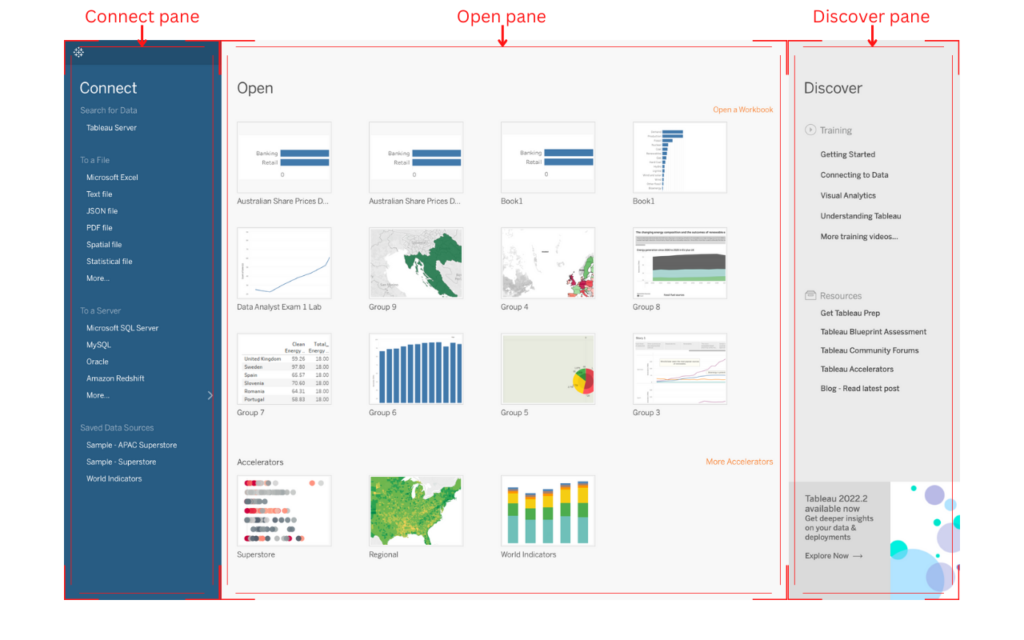
Pane: A rectangular area within an on-screen window that contains information for the user e.g., the Dashboard pane, the Layout pane. Hence, a window can have many panes.
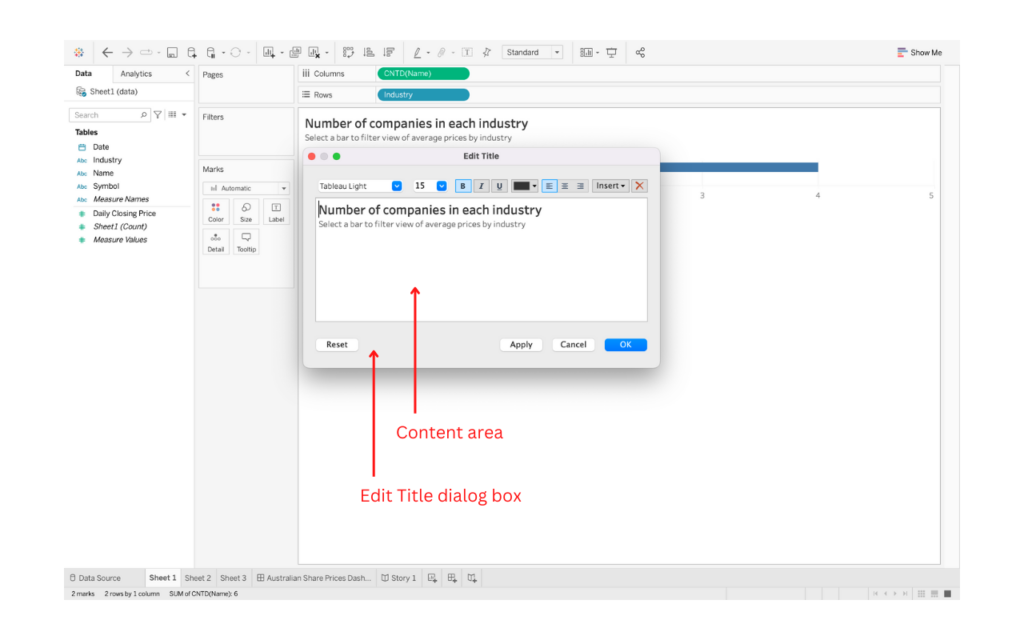
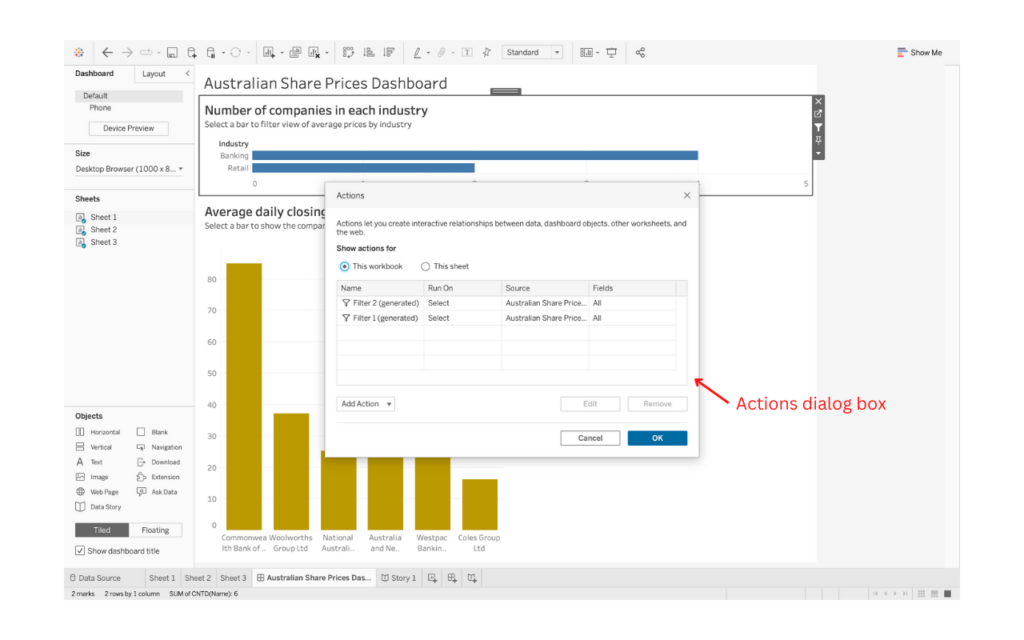
Dialog box: a small window that prompts the user for a response e.g., being prompted to select a file when establishing a new data connection.
Menu: a set of options presented to the user, to help them find information or execute a function.
Menu bar: the menu bar is a strip of (menu) options found at the top of the Tableau Desktop window. For Mac computers, the menu bar spans across the desktop window. For Windows computers, the menu bar spans across the Tableau Desktop application window.
Option: a singular item that can be selected in a menu.
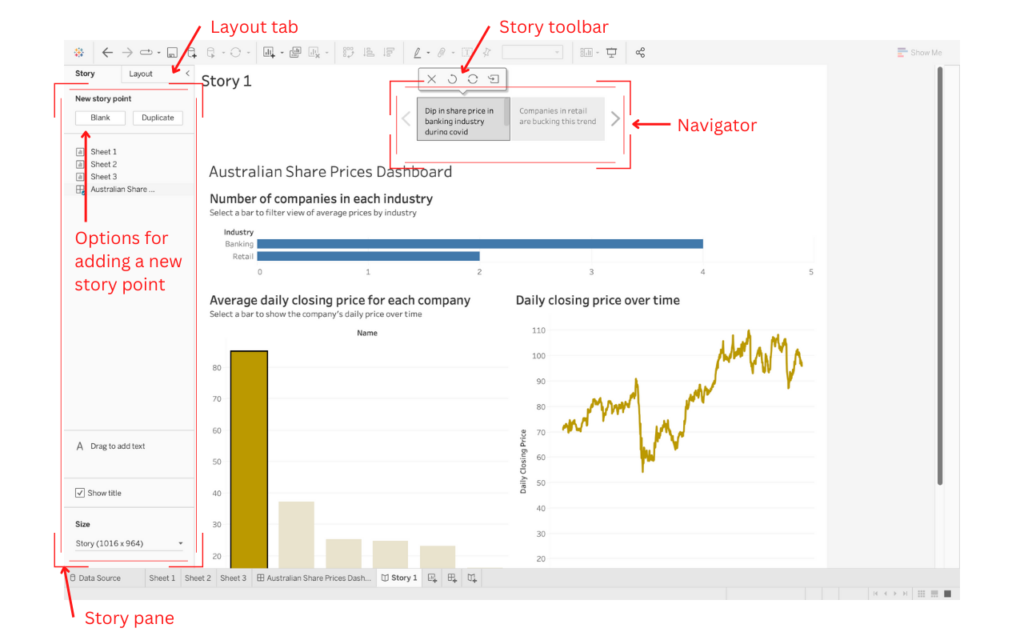
Toolbar: a strip of icons that can be selected to perform certain functions e.g., the story toolbar.
Shelf: A Tableau Desktop-specific interface component, whereby you purely drag in and drag out fields (or “pills”) e.g., the Filters shelf, the Pages shelf. Like a physical shelf, you use it to store items, and you can add or remove items from the shelf.
Card: A Tableau Desktop-specific interface component that gives detailed information about the view and enables interactivity e.g. the Marks card, a Filter card, a Slider card, or a Colour Legend card. Like a physical card, you can read it (i.e., learn information) write on it (i.e., make edits or interact).
Content area: the text input area – used to edit tooltip text and title text.
Concluding remarks
Tableau is really easy to learn.
When learning Tableau, it is super SUPER easy to follow along with an instructor and understand the underlying logic that is used to perform data analytics.
But when it comes to teaching Tableau to someone else, sometimes it can be easy to not know or forget what certain components of the workspace/interface are called.
This boiled-down blog post highlighted the main Tableau Desktop interface components.
For more Tableau tutorials, I would highly recommend viewing Ray Givler’s content on LinkedIn, and sqlbelle’s content on YouTube.
And for more Tableau blog posts like this, see my ‘Tableau for Students’ guide here, or follow or connect with me on LinkedIn to see my latest blog posts.

About the author
Jason Khu is the creator of Data & Development Deep Dives and currently a Data Analyst at Quantium.