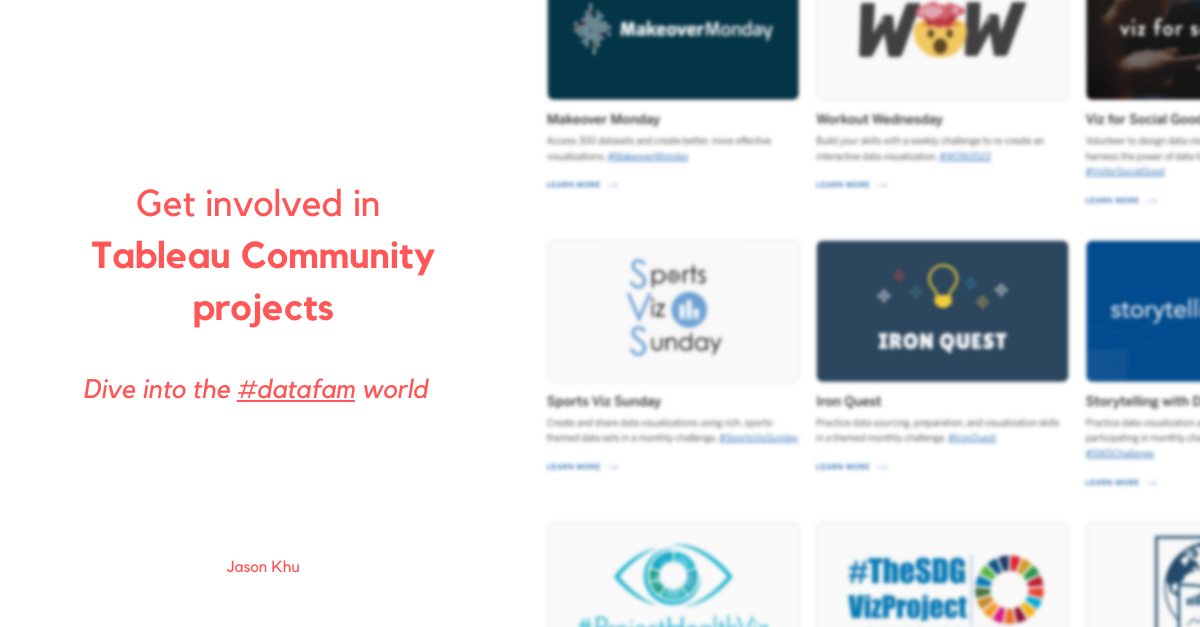
Get involved in Tableau Community projects
Posted on: October 1, 2022
Post Category: Data
The Tableau Community is a special one, among the broader data analytics community.
From my experience, one of the things that make the Tableau Community so unique is the Community projects.
Community projects provide opportunities for members of the Tableau Community to:
- Build up their portfolio and data visualisation skills. Tableau Community projects are hands-on and involve the creation of data visualisations. This helps participants develop their software skills and employment of visual best practices. All members of the community can get involved with (pretty much) any data visualisation software of their choice.
- Engage with others, build connections/relationships and get feedback. Submissions for Tableau Community projects can be shared on social platforms like Twitter and LinkedIn with relevant hashtags. On these platforms, participants can engage with others’ work with valuable comments and receive feedback if requested. After a deadline for a Community project, there may also be a Viz Review, where the hosts share their honourable mentions and feedback.
- Get recognised. Have you work picked by a host or as a Viz of the Day, and build a following of people who are also involved.
From what I have seen on LinkedIn and Twitter over the past two years, the most popular Community projects were Makeover Monday, Workout Wednesday and Viz for Social Good – the top three shown on Tableau’s Community Projects page.
An overview of the most popular Community projects
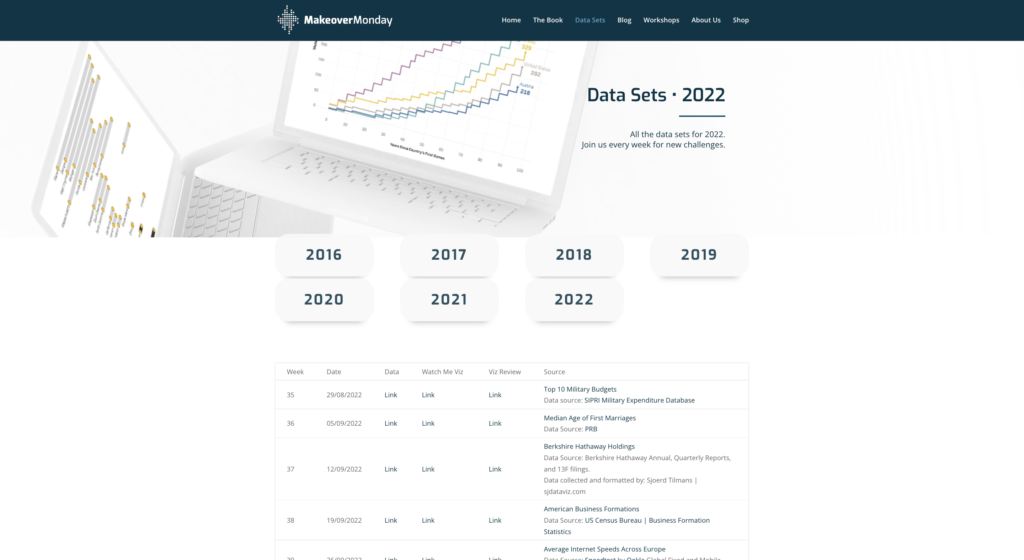
For Makeover Monday: You are given an already-published data visualisation, its (clean) data source, and a link for more contextual information regarding the data. You are asked to apply your knowledge of visual best practices to recreate the data visualisation, to more clearly convey its key message. Exercises are published weekly on Monday. Learn more here.
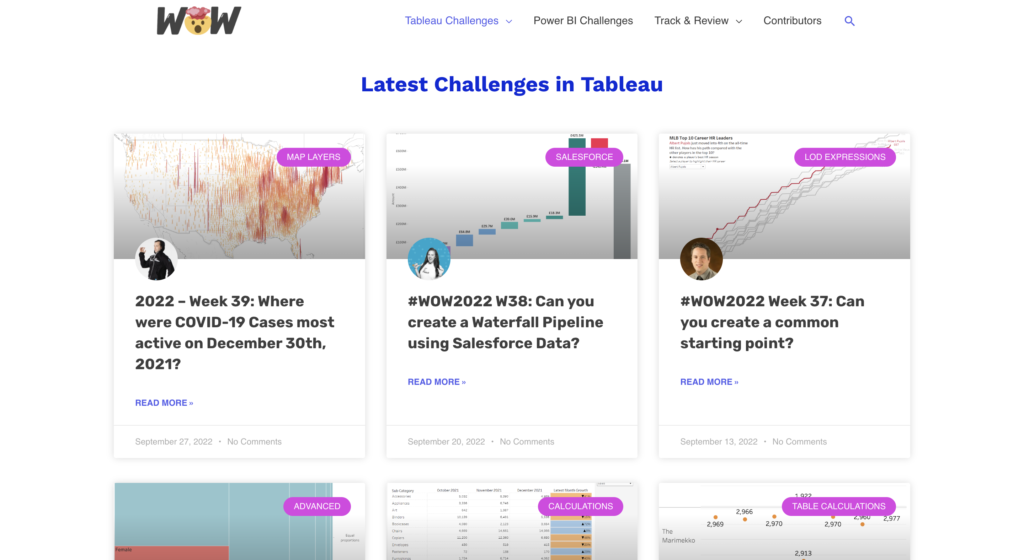
For Workout Wednesday: You are given a data visualisation that leverages a specific function/feature in Tableau. You are then asked to recreate this data visualisation. Exercises are published weekly on Wednesday – for Tableau AND Power BI. Learn more here.
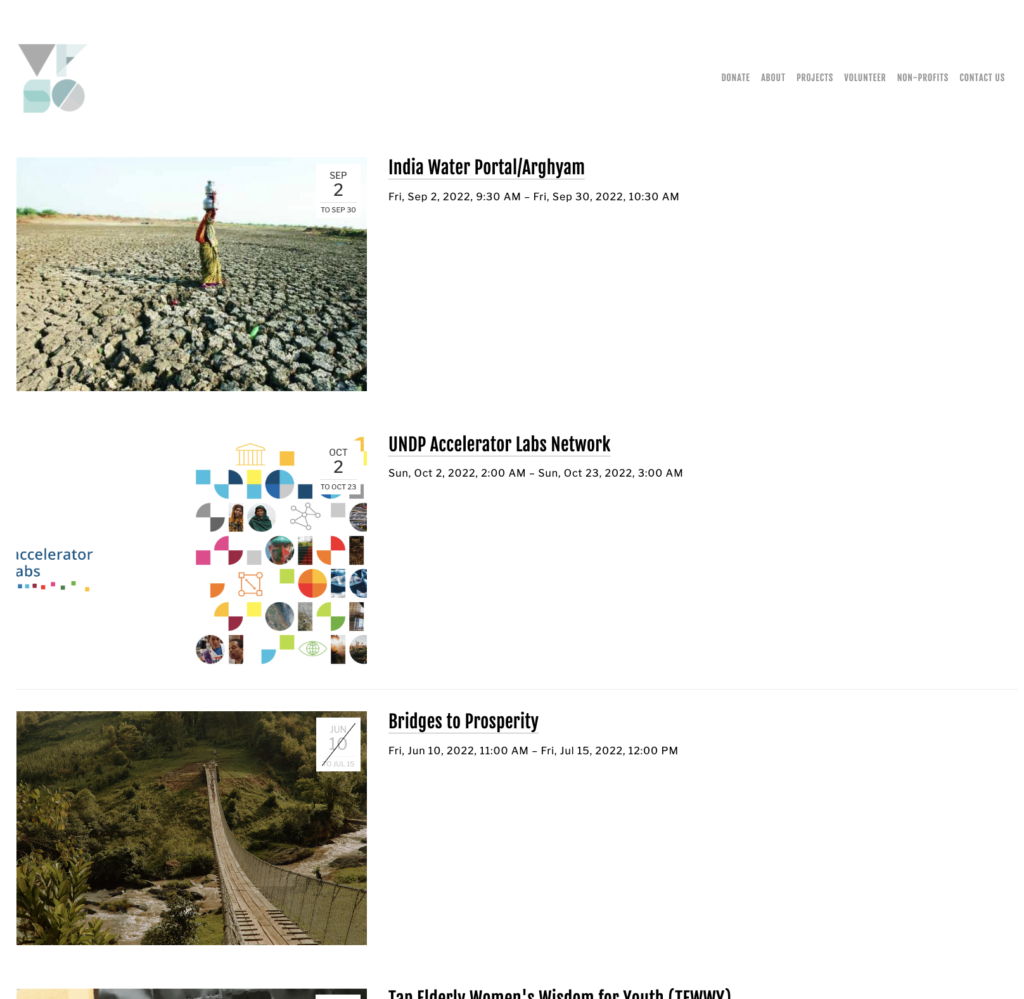
For Viz for Social Good: You are given data from a non-profit charity, and you get the opportunity to create a dataviz that communicates their impact. This dataviz could be used in their reporting or shared on their social media platforms. Projects for Viz for Social Good are launched whenever requested by the charities. Learn more here.
Overall, Tableau Community projects provide ample opportunities to help data analysts – from all experience levels – to build their skills and meet like-minded people.
See ALL of the Tableau Community projects that are currently out there here – including ones for sports enthusiasts, gaming enthusiasts and more!

About the author
Jason Khu is the creator of Data & Development Deep Dives and currently a Data Analyst at Quantium.