A deep dive into Johanna’s journey – from student to data analyst
Posted on: October 2, 2022
Post Category: Student Guide

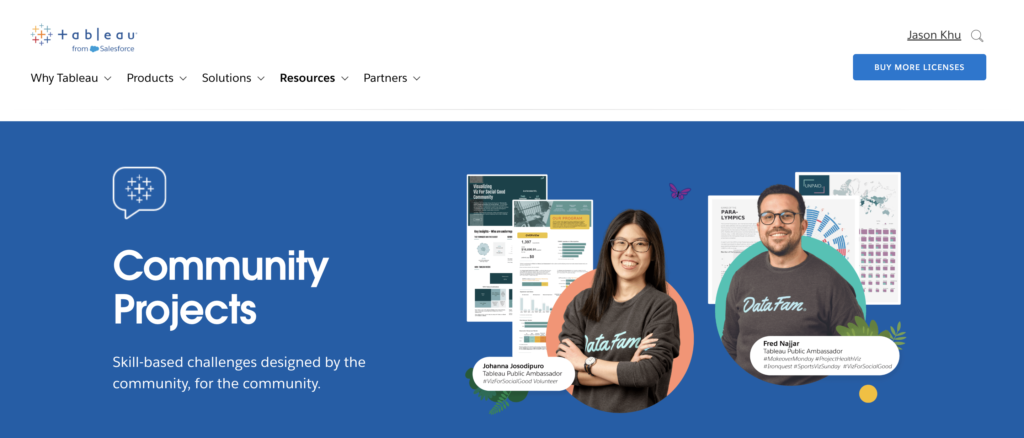
Over the past two years, I followed Johanna’s journey on LinkedIn. And during that past year, Johanna had tremendous accomplishments, like volunteering for Viz for Social Good, getting recognised for Viz of The Day, and becoming a Tableau Public Ambassador (twice!). What made her journey stand out to me was that, for part of her journey, she was still a student.
It’s a huge privilege to have her contribute to the ‘Tableau for Students’ guide by sharing her experience. Johanna’s work and contributions to the Tableau Community have been nothing less than admirable.
– Jason Khu


Jason:
Thank you, Johanna, for agreeing to share your experience! Can you please tell the readers a bit about yourself – your education, background, interests…?
Johanna:
Sure. But before that, thank you Jason for the opportunity! I’ve seen your previous work as a Tableau Student Ambassador and it’s inspiring how you’ve helped students develop their data skills. I hope my experience can be helpful for students.
I’m Johanna and I’m currently working as a Data Analytics Consultant at The Data School Down Under, which also happens to be my very first job after graduating. Before that, I was a Master’s student at USYD studying Commerce, specialising in Business Analytics and Marketing. I started my Tableau Public journey last year in September while still studying and I can say that it was one the best decisions of my life as it led me to discovering the Tableau community. I’ve never imagined that I would learn heaps along the way and didn’t even give up in the middle 😂. Looking back at how people in the community have inspired me, I’m so thrilled and thankful that recently I’ve been selected to be one of the Tableau Public Ambassadors. Outside work, I enjoy listening to music, sipping hot tea or just randomly browsing the internet including scrolling through Tableau Public.
Jason:
Thanks for that, Johanna. So what and/or who inspired you to build a career in data analytics?
Johanna:
Since young, I’ve always enjoyed analysing things. I used to keep track of my grades in school in Excel and analysed them. Computer studies was also one of my favourite subjects back in school. That was a time when data analytics wasn’t a thing yet or perhaps it existed, but I wasn’t aware of it. I also have this “artsy” side, I used to make custom-designed playing cards for my friends back in school and enjoyed drawing. Even back in uni, you can find me adding some design touches to my teams’ slide decks or reports. So it just felt natural that I found data analytics and visualisation exciting. It has both ‘problem-solving’ and ‘designing’ elements that I just like.
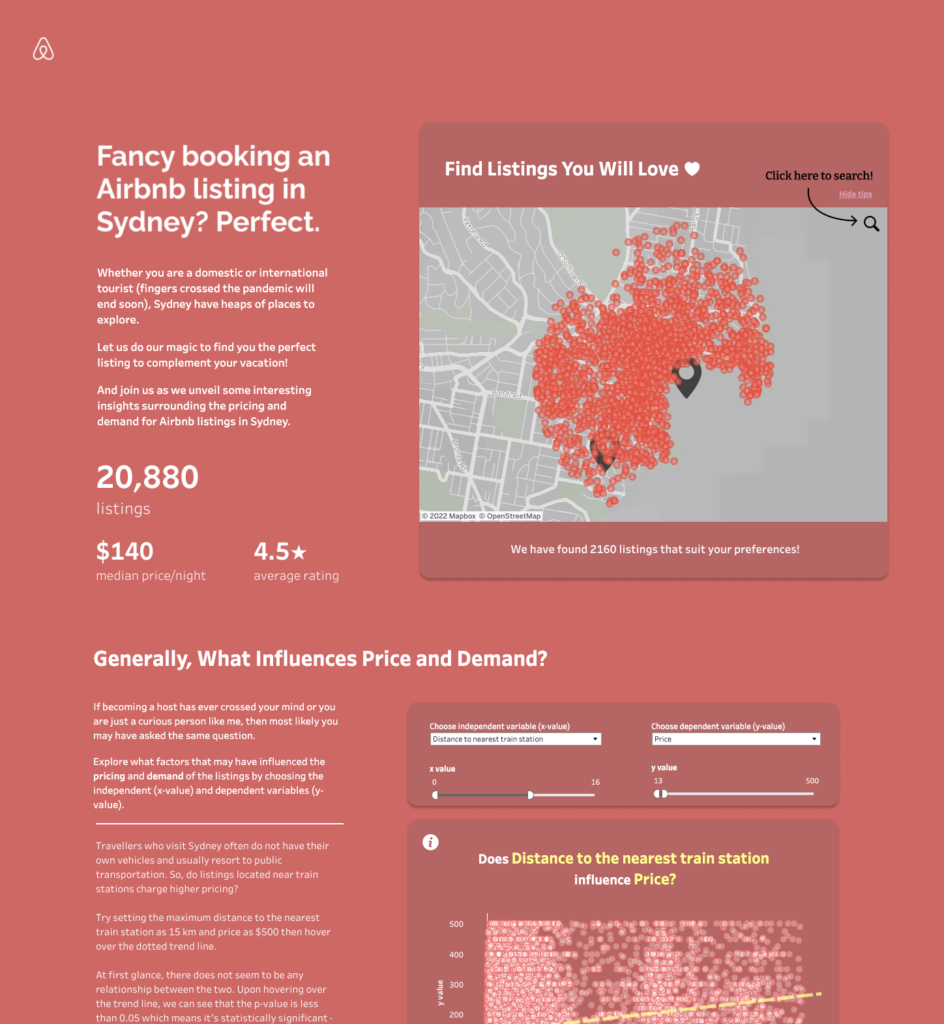
But liking something as a hobby and doing it as a day-to-day job can be two different things. And what better way to know than by testing the water and getting my hands dirty? So I was looking for projects I could work on. I was thinking that if I was going to work on a project anyway, why not for non-profits that are creating impact? For the tool, Tableau crossed my mind at that time, as I was introduced to it in one of the courses I took in uni. After some googling, I then stumbled upon the Viz for Social Good community initiative.
I found it incredibly fulfilling and rewarding to figure out what the stakeholder really needs and to discover valuable insights for them. It was at that moment that I decided it was something that I want to do every day and pursue as a career.
Jason:
That’s amazing! On that topic, what resources and/or community initiatives did you leverage to build your data analytics skills thus far?
Johanna:
I’ve mentioned one of the community initiatives, VFSG. It’s the only initiative where there’s a real stakeholder involved, which makes it a great way to hone my skills in figuring out the “real” requirements or what the stakeholders really need. The data is also not as clean as other initiatives but at the same time, it’s not as messy or enormous as the data of clients I found at work. For some projects, the committee even published an additional pivoted dataset that is more beginner-friendly so I found it a good practice when still starting. Overall, it gave me a well-rounded experience from preparing the data to finally presenting my work to stakeholders.
Workout Wednesday is also a great way to practice technical skills and I often discover other use cases that I didn’t know.
I have participated in other initiatives but I usually like to look through the submissions. There are also initiatives that incorporated feedback for their submissions like Iron Quest, for example. I found it useful to watch the feedback sessions and gradually learn what works, and what doesn’t work. Makeover Monday also has feedback sessions but when I was starting my journey it was on hiatus.
There’s another great community initiative for beginners too, called Back to Viz Basics (B2VB). They run fortnightly and usually focus on a particular chart type/topic.
As for resources, there are many tutorial videos on YouTube. Some that I watched are Andy Kriebel, sqlbelle, Tableau Tim, The Information Lab and VizConnect. Tableau User Group talk recordings can also be found on the Tableau Software YouTube.
Jason:
Thanks for sharing those, that was really insightful. On that same topic, regarding learning resources…
From what you have learnt, what resources would you recommend for someone who wants to build their career as a data analyst? And do you think there are specific skills/tools/applications that an aspiring data analyst should learn, and if so, what are they and why should they learn them?
Johanna:
Firstly, I think there’s no one size fits all, so what works with me may not necessarily work with others. So far, these are some skills that I think are useful to have.
Basic statistics. Stats help explain the relations of the data, basically the story of the data itself. For stats, I mainly learned from school and uni. But there are good resources out there that people usually recommend like Khan Academy.
Best visualisation practice. Rules exist for a reason, and understanding them often can help you create visualisations that are more effective to convey your insights. Just keep in mind that the rules are often not absolute and most of the answers would be: “it depends”. My favourite tip is to use colour with purpose and not to use the same colours interchangeably for different meanings. Using colour carelessly can cause confusion as people tend to associate the colour with the meaning subconsciously.
The skill of structuring and conveying your insights in a logical manner. In the end, you want to create value out of the data for your stakeholders. If your audience cannot understand what you deliver or is left confused about how the insights can be useful to them, then the data become meaningless. I picked this skill up from my debating days back in uni during my bachelor’s degree. But you can also train this from your uni writing assignments or presentations 😀. Those sleepless nights to complete uni assignment – it’s finally worth it.
For the tools, I recommend looking at the description of job opportunities. Different cities/countries may also have more opportunities in certain tools than another. But what I noticed is most data analyst jobs ask for Tableau/PowerBI and SQL. Some companies use Alteryx for data wrangling. Tableau has a free license for students and even includes free e-learning so students can take advantage of that.
Jason:
That was really comprehensive, thank you! I’m sure these insights will be helpful for the students reading.
And finally, do you have any other general advice for students that would like to build their career as a data analyst?
Johanna:
Go for it! Build a portfolio, work on projects and learn as you go. The hardest part is usually taking the first step. When I was starting I often thought “What if my work’s not good enough?” or “Other people are more experienced”. But at the end of the day, everyone starts somewhere. And everyone has something unique that can be brought into their work.
Also, utilise the resources around you. Many companies provide their software for free to students, give them a try. I saw some students struggle to search for data projects to work on, community initiatives offer an avenue to have hands-on experience. You can also publish your work to Tableau Public and see it as your free portfolio site. Keeping track of how you’ve progressed will motivate you more! And potential recruiters can see your growth too.
Finally, it’s a never-ending learning journey. Keep upskilling and enjoy the journey.

About the author
Jason Khu is the creator of Data & Development Deep Dives and currently a Data Analyst at Quantium.
Notice:
Let me know if you want a resume review from me.
I have written a Data Analyst resume checklist, which will be free for you to read when my Data Analyst Guide gets released on the 3rd of June, 2024.
But if you want specific feedback from me, delivered in a short 30-minute to 1-hour call...
Please let me know through LinkedIn, and I'll see what I can arrange!
Pricing TBD.
- Jason